


Charts and graphs
Research has shown that many individuals prefer to receive information graphically rather than from numbers or written text. The charts and graphs below were derived from various sources, including CDA studies. Please feel free to download and print the charts and graphs to support your needs, and help support our mission to raise awareness of the risk of disability through education and public awareness.
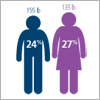
Infographic: The Disability Disconnect
Download our handy infographic highlighting the risk, causes and consequences of disability, and how wage earners’ perceptions differ from the reality.
Download PDF for electronic use
2. Disability Divide: Worker Research Study

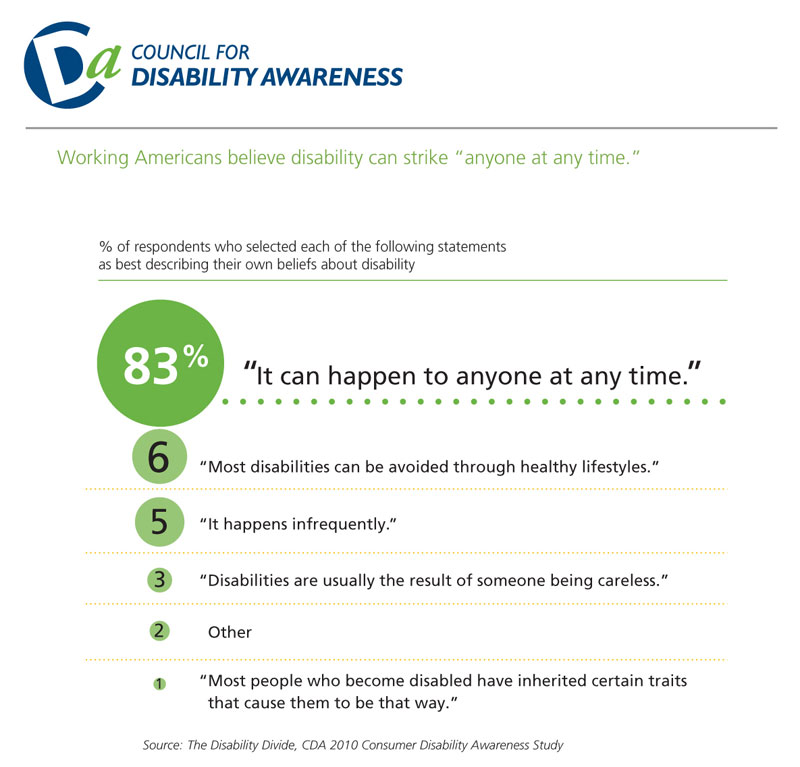
- Disability can happen at anytime (JPG |PDF)
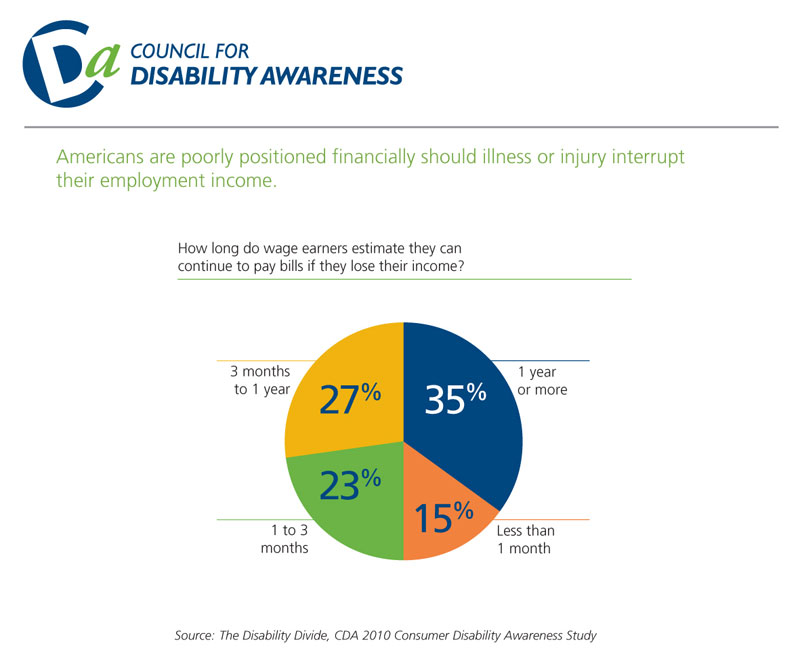
- Percent who could pay the bills with no income (JPG |PDF)
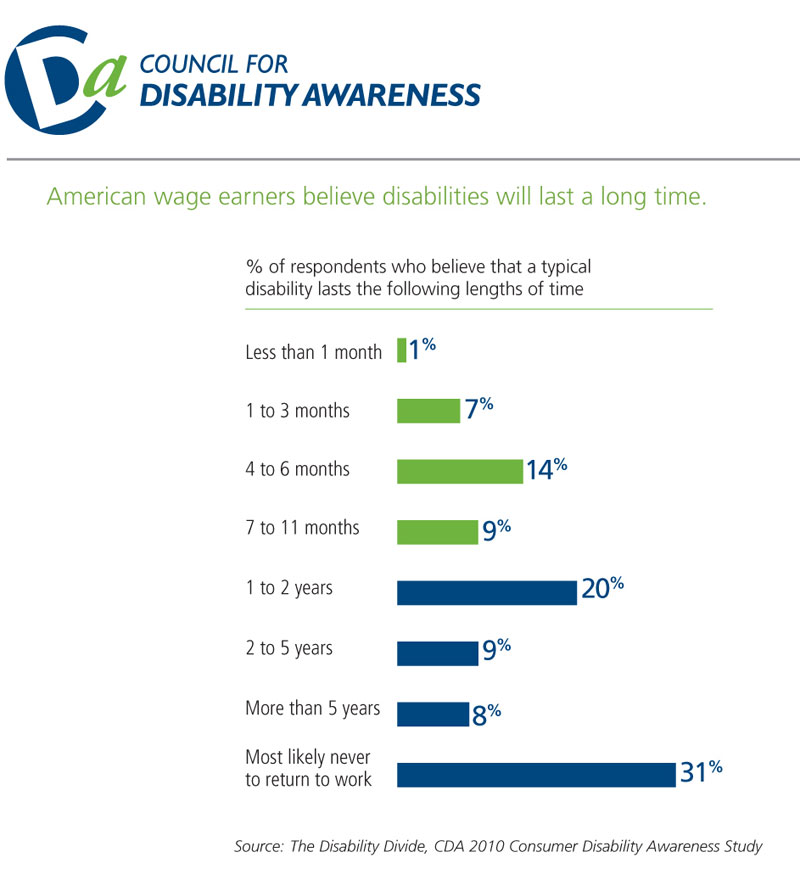
- Percent who believe disability typically lasts “X” amount of time (duration) (JPG |PDF)
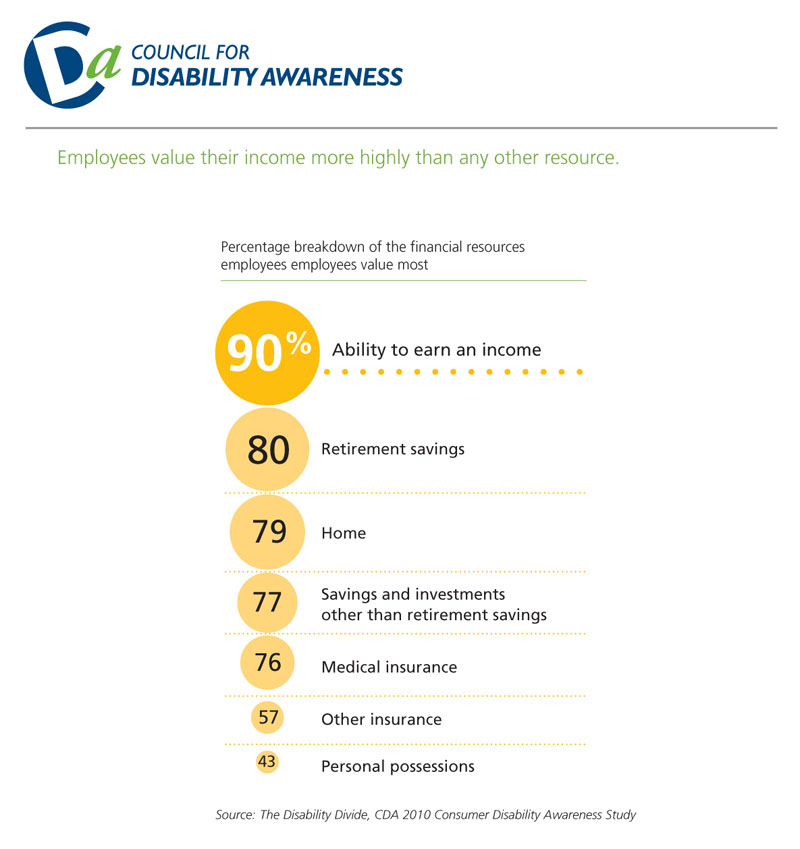
- What employees value (financial resources) (JPG |PDF)
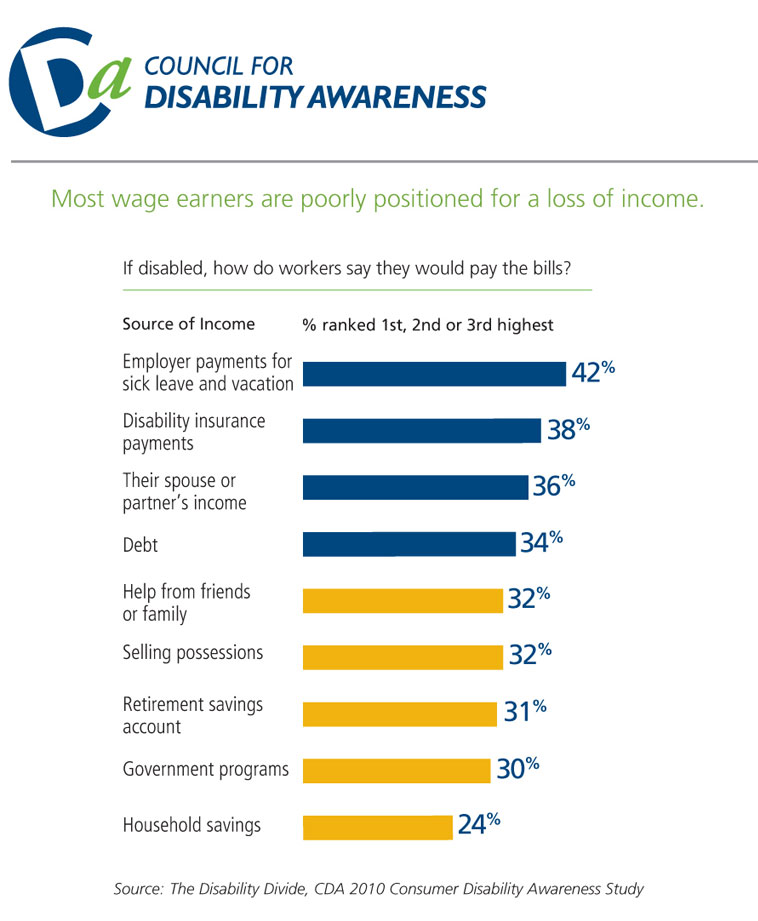
- Where would the money comes from to pay bills if disabled? (JPG |PDF)
3. CDA Annual Long Term Disability Claims Review (2014)
This section last updated June 13, 2014
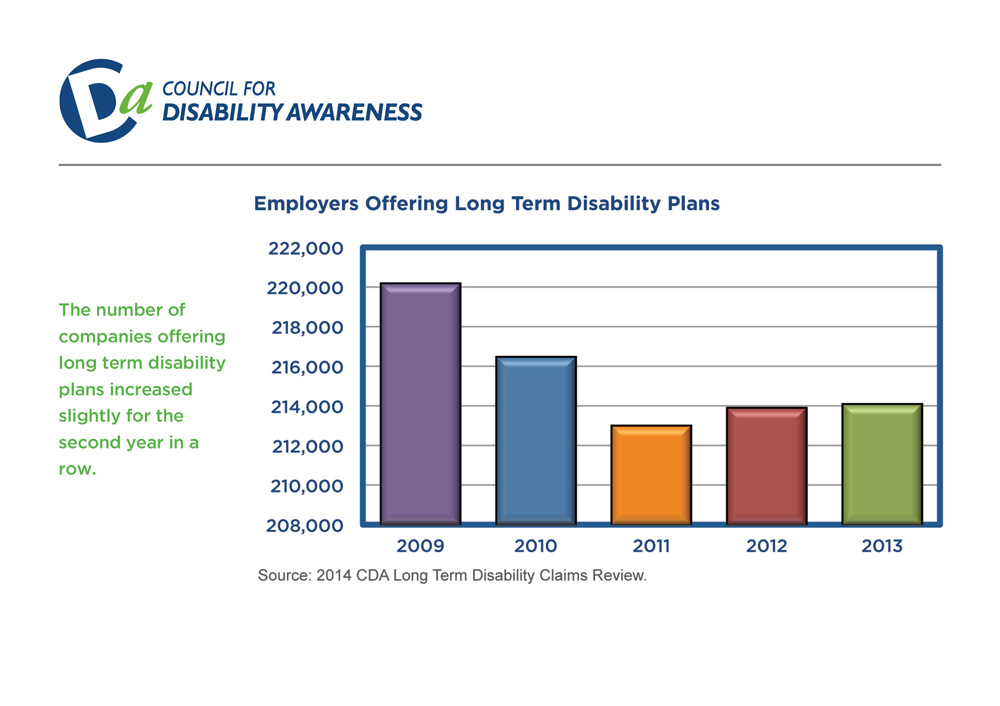
- Number of employers with LTD plans (View Chart)
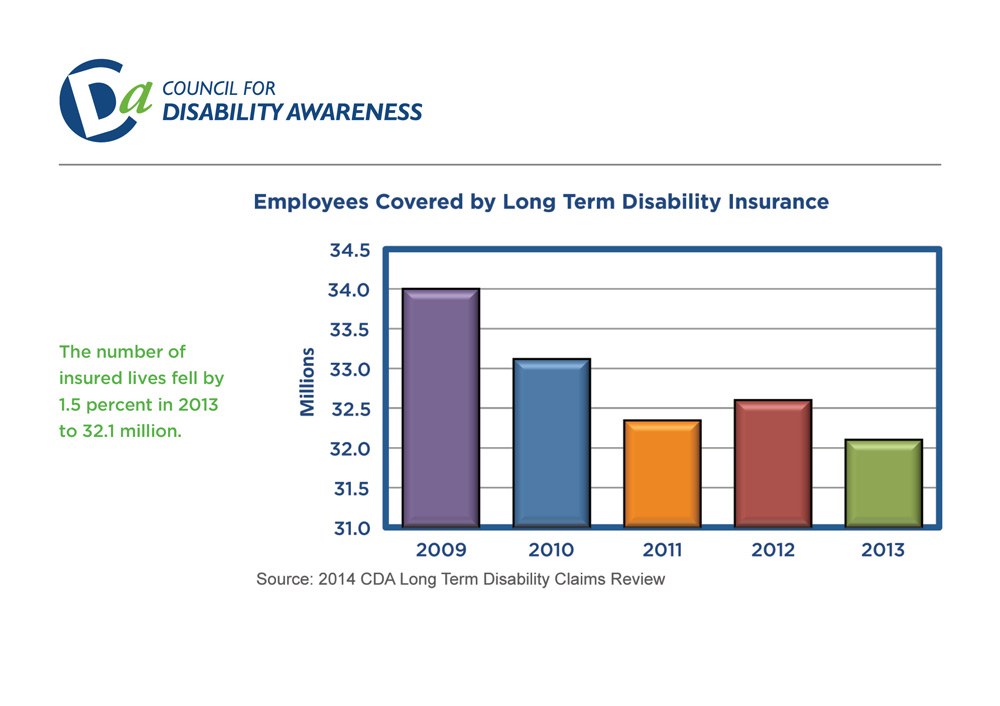
- Number of employees with LTD coverage (View Chart)
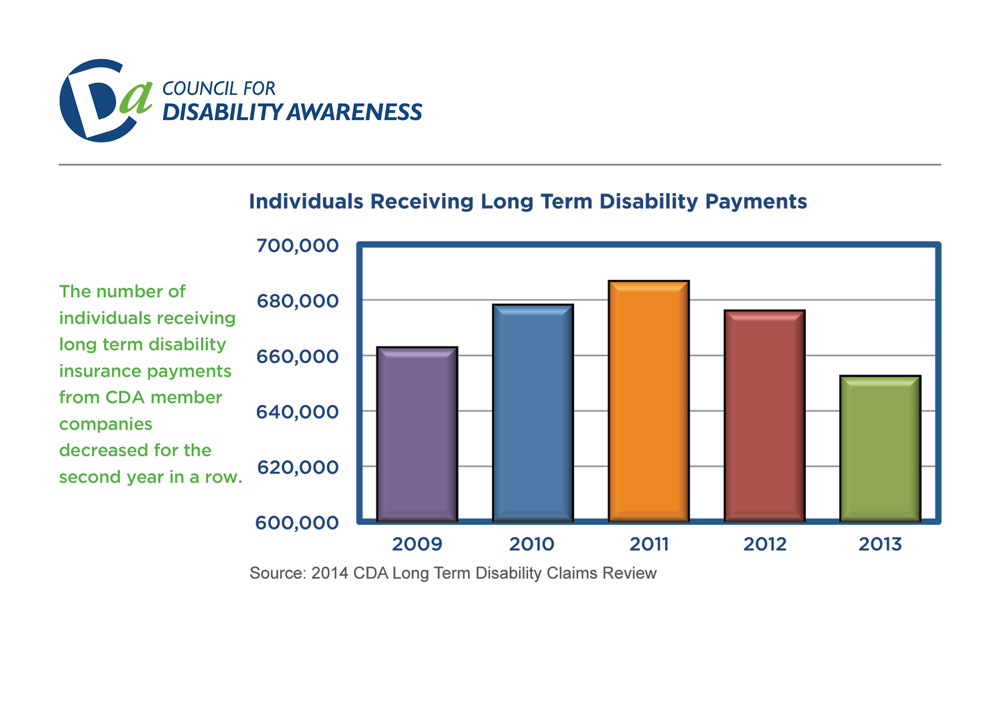
- Number receiving disability payments (View Chart)
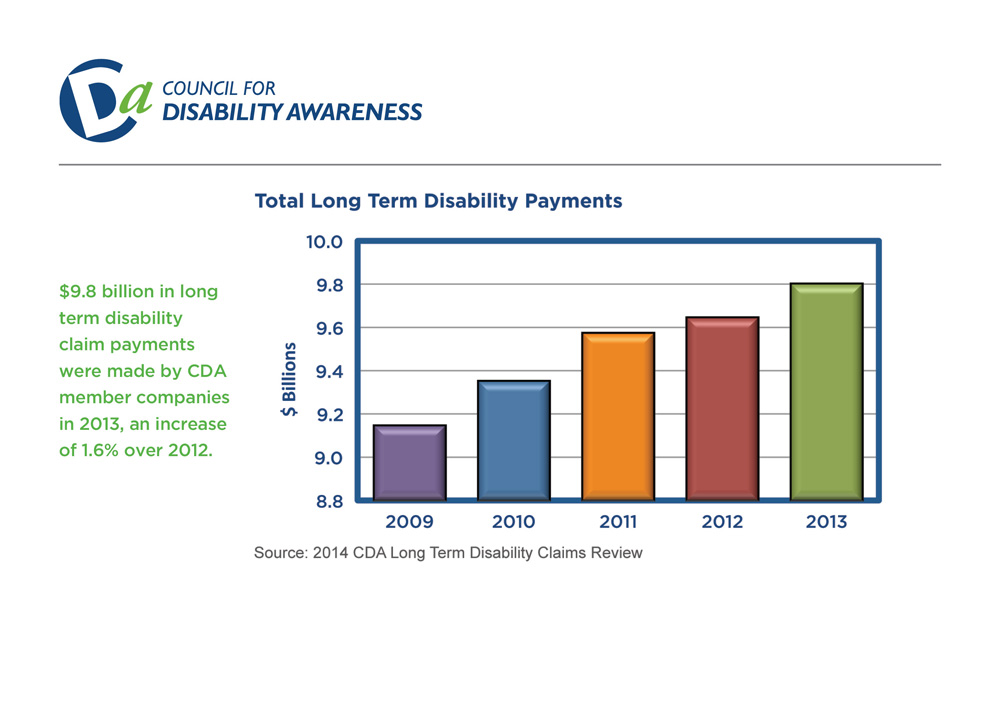
- Total disability payments (View Chart)
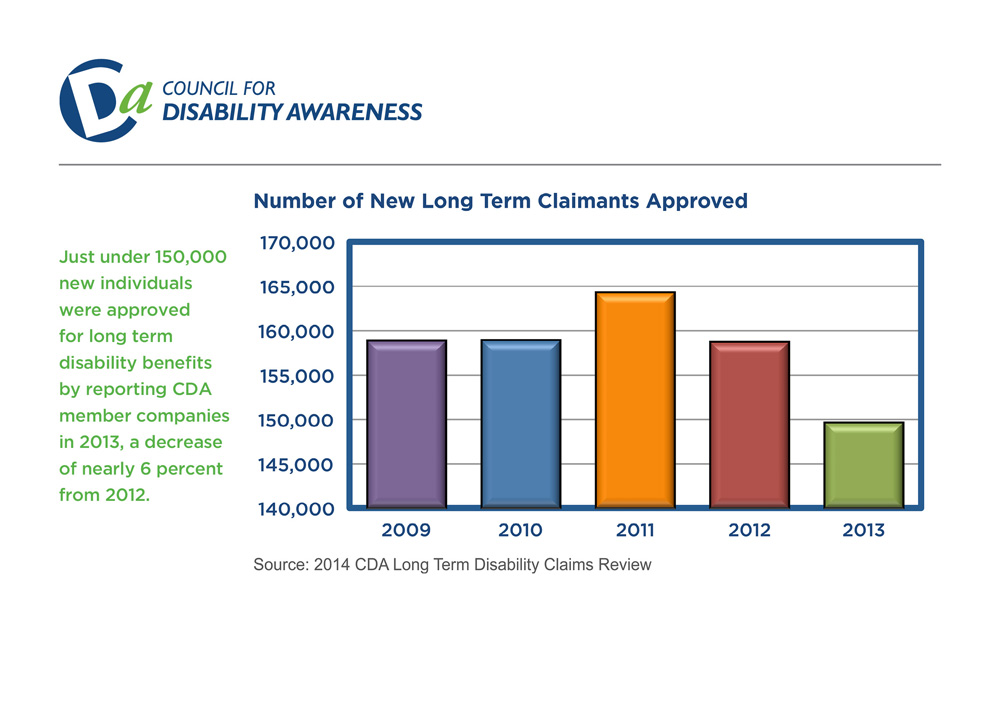
- Number of new disability claims approved (View Chart)
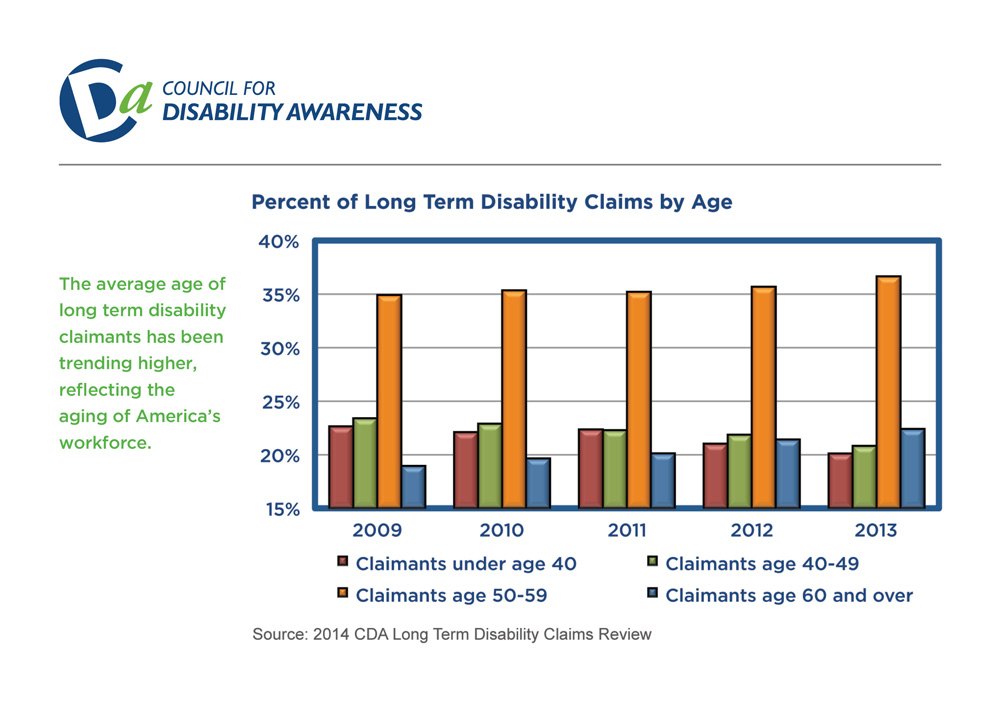
- Percent of disability claims by age (View Chart)
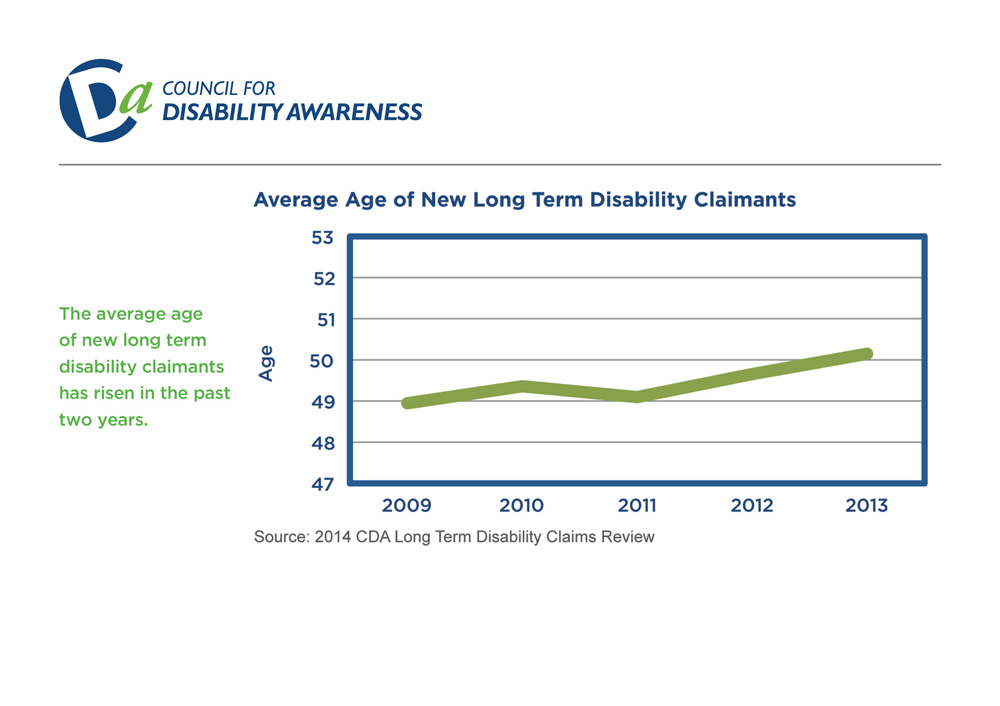
- Average age of new claimants (View Chart)
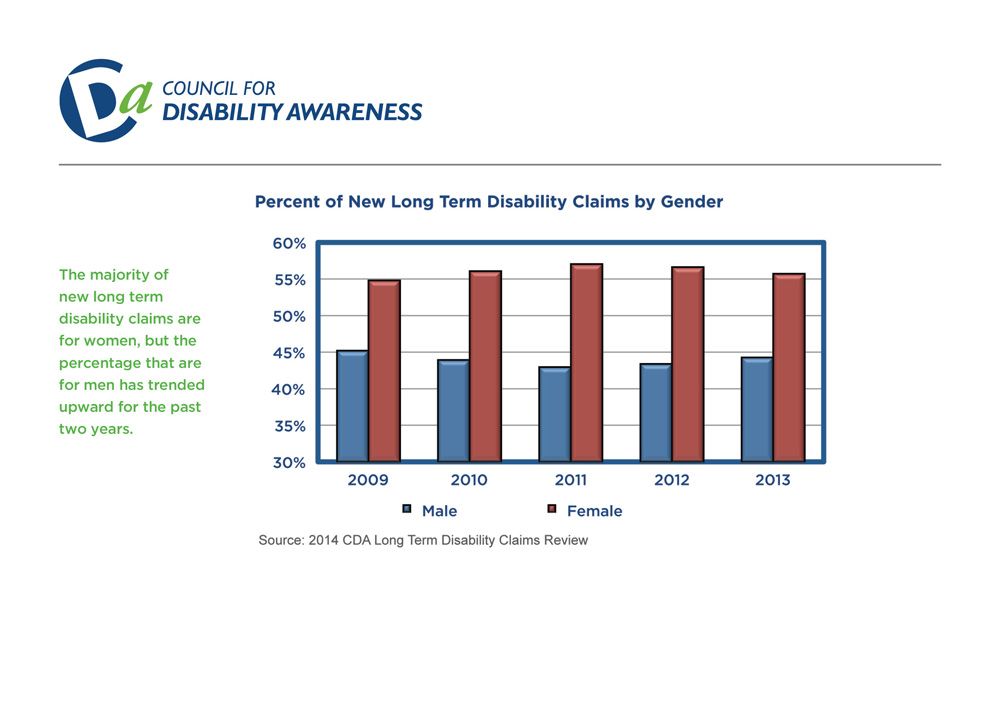
- Percentage of new claims by gender (View Chart)
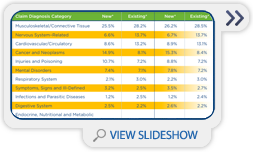
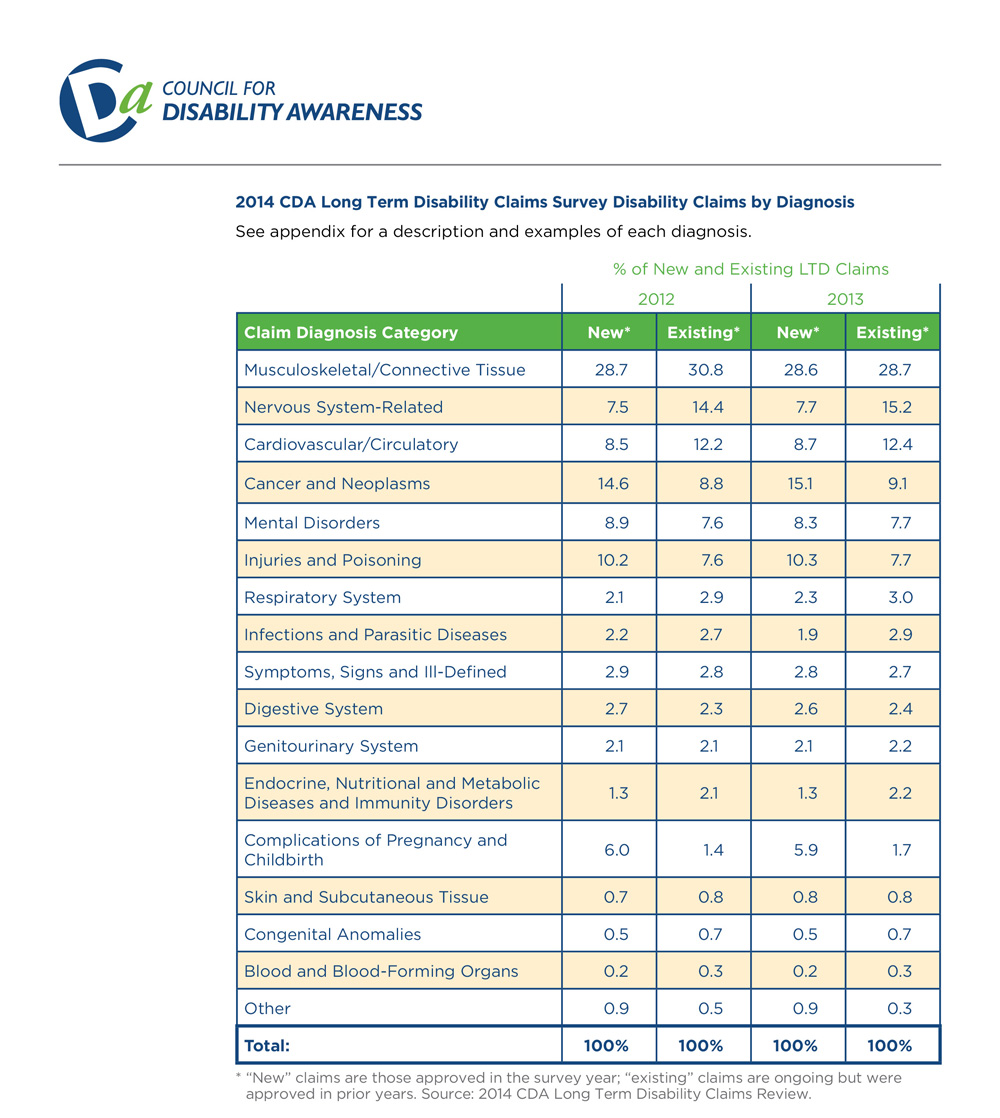
- Percentage of claims by diagnosis (View Chart)
4.Social Security Disability Insurance (SSDI) Data
This section last updated June 13, 2014
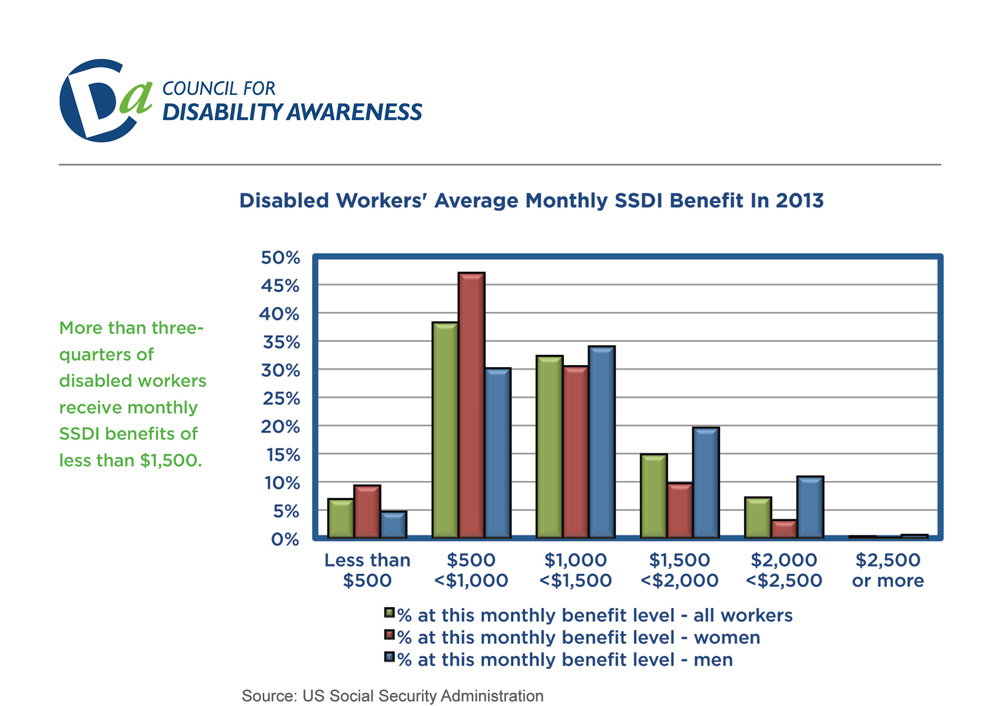
- Average monthly SSDI benefit by gender (View Chart)
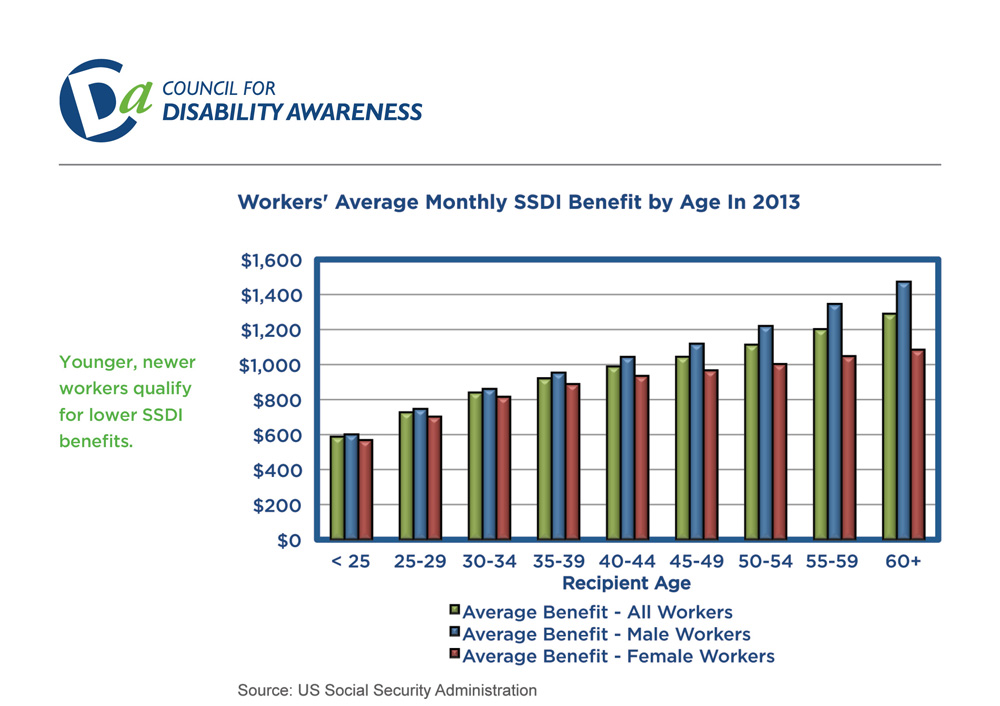
- Average monthly SSDI benefit by age (View Chart)
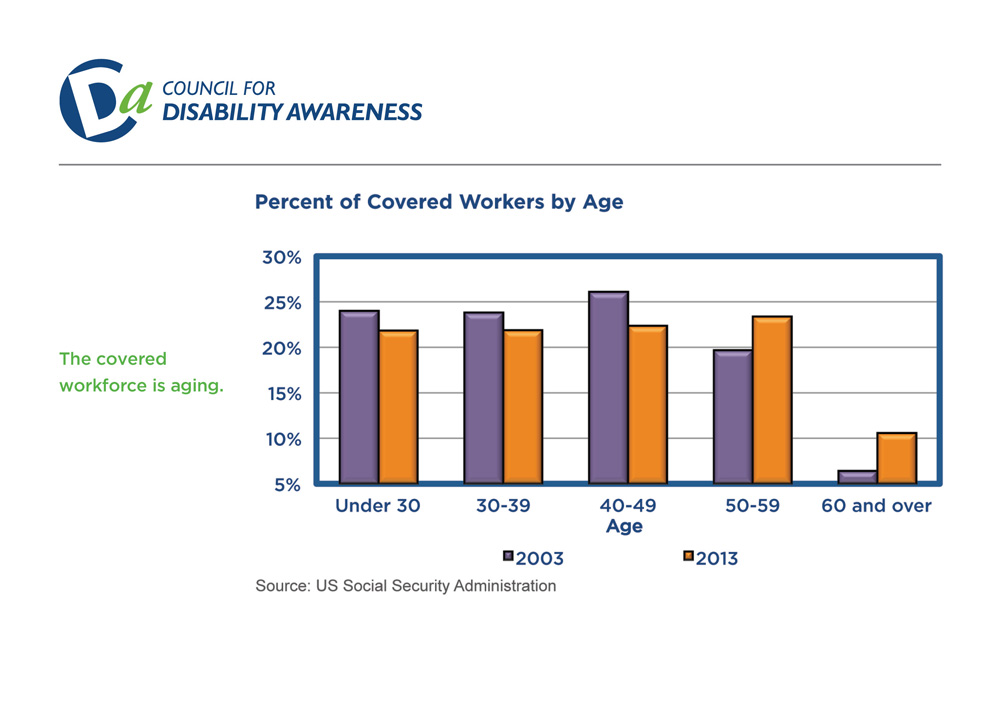
- Percent of covered workers by age – 10 year comparison (View Chart)
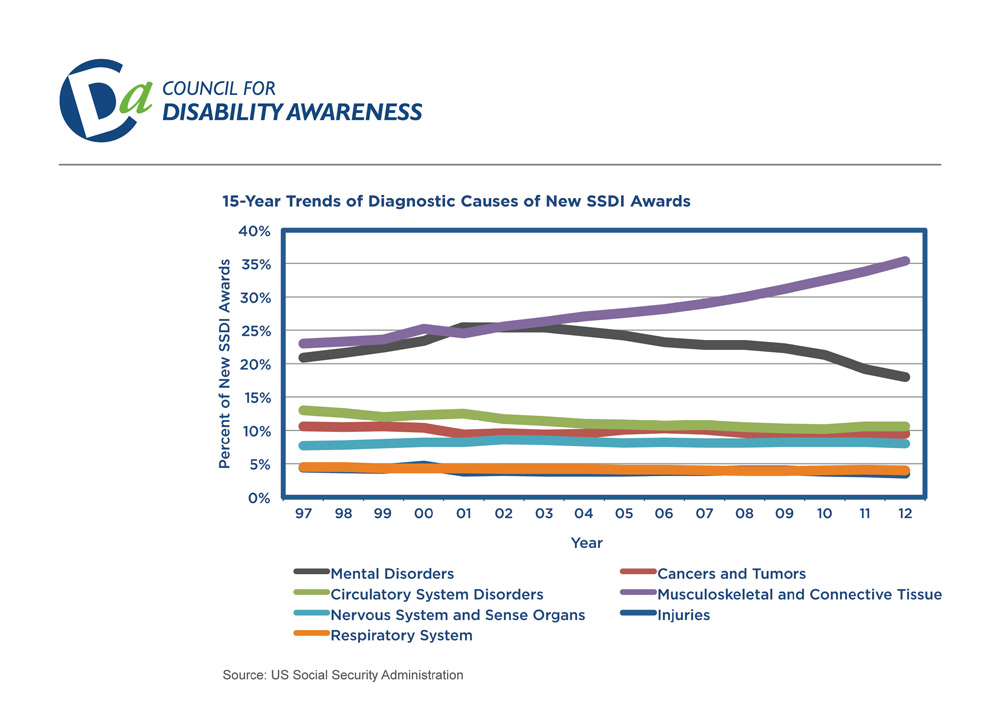
- Diagnostic causes of new SSDI awards (View Chart)
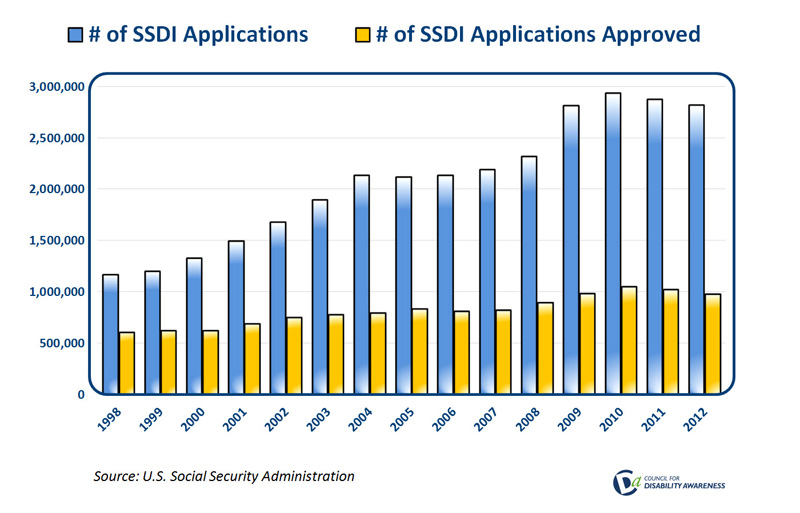
- Number of SSDI applications, number approved (View Chart)
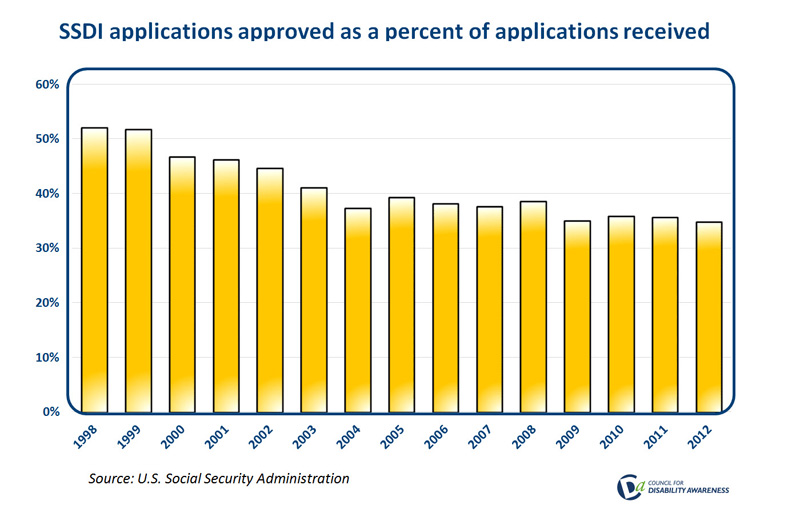
- New SSDI awards as a percentage of applications (View Chart)
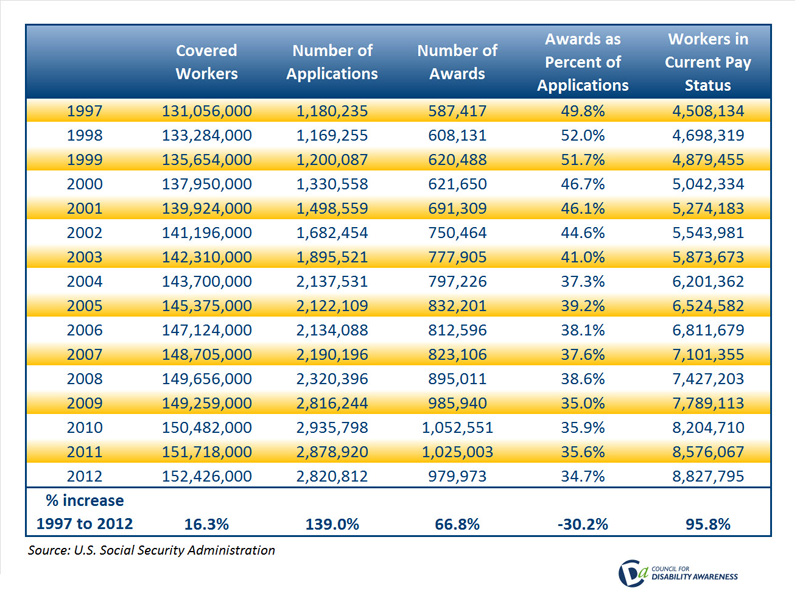
- SSDI historical payment data (View Chart)
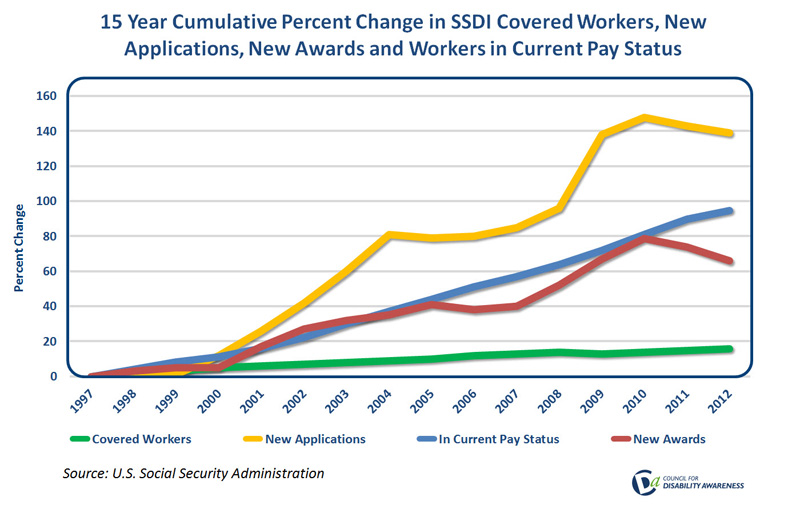
- Fifteen year SSDI trends (View Chart)